Reports Menu > Sales Reports
Sales Reports
View statistics about order amounts, discounts, tax and shipping.
-
Click on the Reports menu item to view a list of all reports available.
-
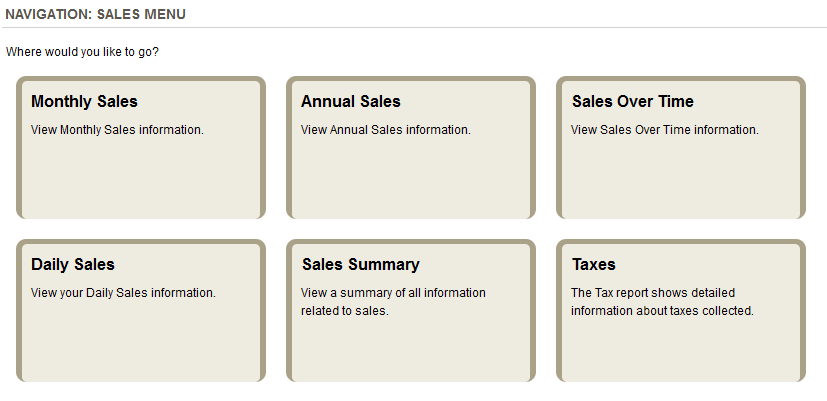
The Sales Reports section is shown below.
-
Monthly Sales - Graph and report showing details for any month.
-
Annual Sales - Graph and detailed report showing orders from the last 3 years.
-
Sales Over Time - Shows sales for the custom time frame selected.
-
Sales Summary - Provides an itemized report of totals for the selected period.
-
Daily Sales - Detailed report showing all orders for a day and the totals.
-
Taxes - Breakdown of total taxes, for each tax rate, for the selected period.
Monthly Sales
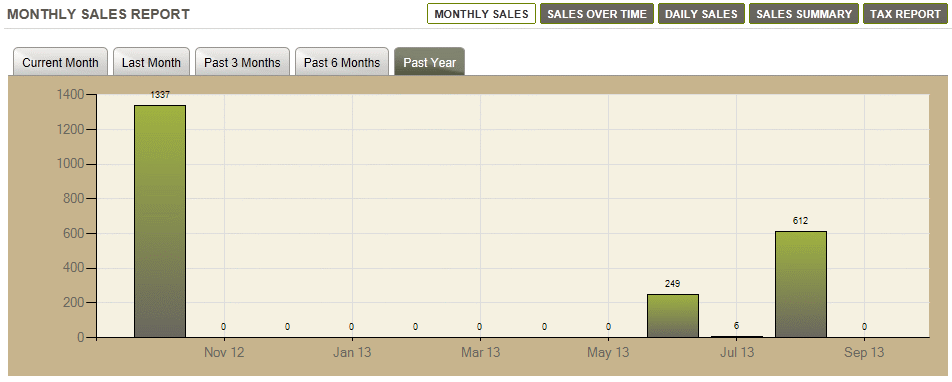
The Monthly Sales report displays information about sales in the current month, last month, past 3 months, past 6 months, or the past year. The graph displays in a format that allows merchants to easily see sales trends over a period of time.
Annual Report
The Annual Sales report is new in AbleCommerce Gold R12. It will show your sales for up to three years. The sales are shown by month and color coded for each year.
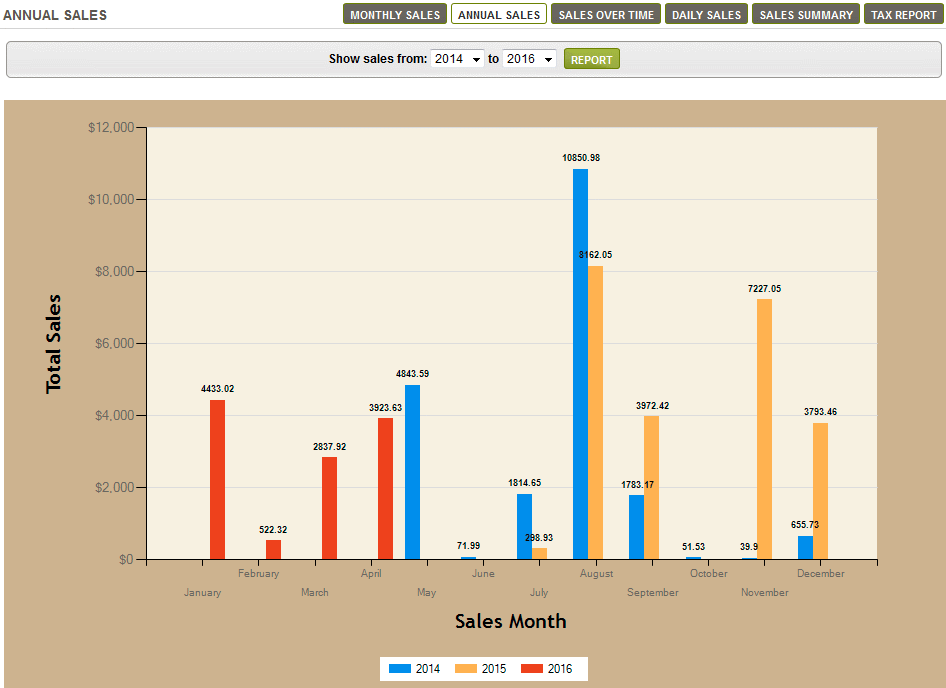
Below the sales graph is a detailed output showing the year, month, and total sales amount.
Sales Summary
The Sales Summary report displays detailed sales information for the selected period of time.
-
Select a Report Period using the Calendar picker icon.
-
View the results as shown in this example below.
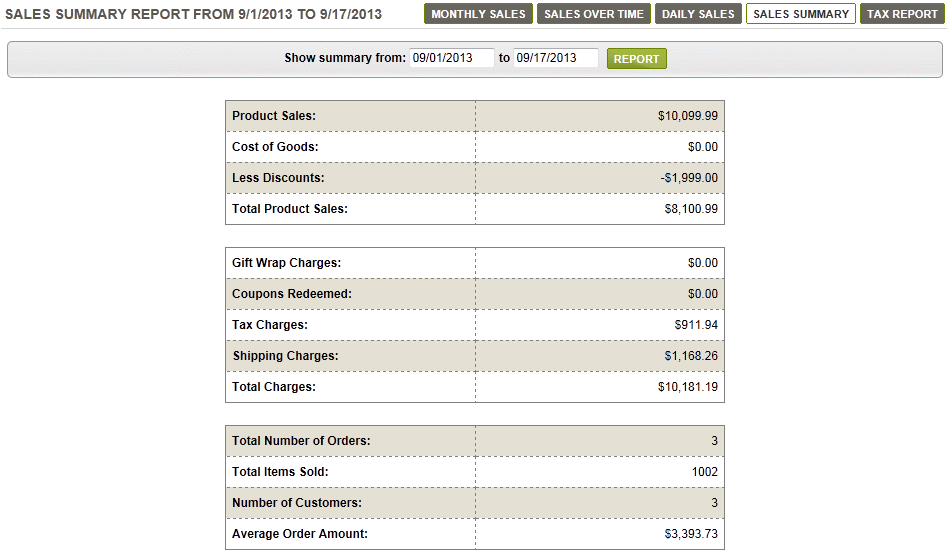
This itemized report shows the total Product Sales, discounts, tax, and shipping for the selected report period.
The total number of orders, items sold, customers, and average order amount are shown as well.
Daily Sales
The Daily Sales report displays the current day's sales information.
-
Using the Calendar picker, you can select any one day for the report period.

Unlike the Sales Report, you will have an itemized list of each order placed for the day.
Click on the linked Order Number to view the details of a single order. You can Export Results to a CSV file.
Sales over Time
The Sales over Time report displays the current months's sales information in both graph and report formats. You can Export Results to a CSV file.
-
Select a Report Period using the Calendar picker icon.
-
At the top of the page, a graph is shown for the time period selected.
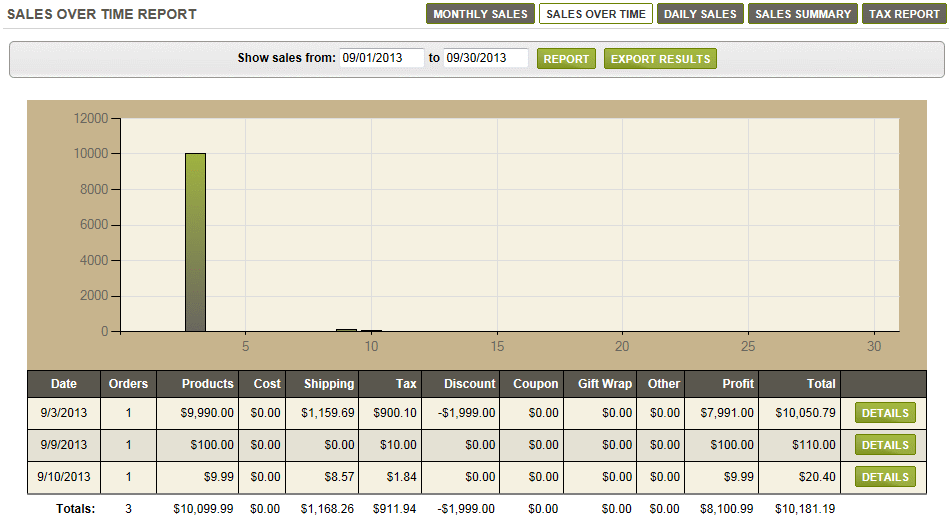
The top graph represents the total number of sales for the selected period, and at the bottom of the graph, each number represents the day of the month. -
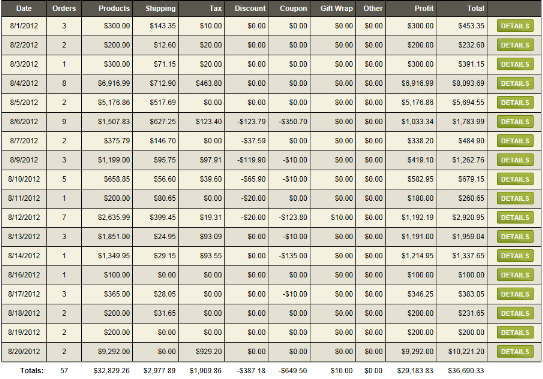
Beneath the graph is the same data represented in a detailed report format.
Click on the DETAILS button to view the Daily Sales Report for the day selected.
Tax Report
The Tax Report displays a detailed report of all tax rates and the total amounts collected for each.
-
By default, the Country and State/Province selections are populated using the default warehouse of your store. You can adjust the filter as needed to display taxes collected by a specific region or custom defined zone.
-
Select a Report Period using the Calendar picker icon. You can Export Results to a CSV file.
-
View the results as shown in this example below.

The Tax Rule(s) will appear with the total amount collected for each. -
Click on the linked Tax name to view a detailed report. An example is shown below.

Each order where this tax was collected is shown.
You can click on the linked Order Number for details.
Go to Site Map