Customer Reports
Table of Contents Show
Sales by Customer
The Sales by Customer report displays customers, and their order totals, for the selected period of time.
Using the menu, go to the Reports > Customers > Sales by Customer page.
Select a time frame FROM and TO using the Calendar picker and click the Report button.

View the results as shown in this example below.

This report a breakdown for each customer, the total number of orders, and the total sales amounts.
Click on the linked email address to view the purchase history for an individual account.
New and Existing Customers
This report will show a comparison of the number of new customers and existing ones, with completed orders, for each day.
Using the menu, go to the Reports > Customers > New and Existing page.
Select a time frame FROM and TO using the Calendar picker and click the Report button.

View the results as shown in this example below.
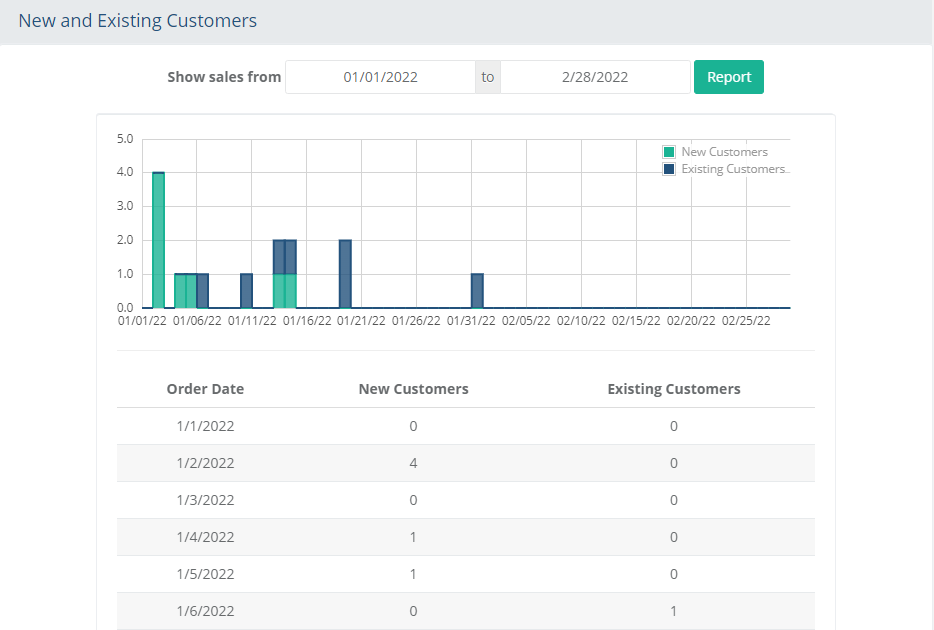
Technically a user can get counted multiple times in the same day. If someone places an order in the morning as a brand new customer, and then later that same day places a 2nd order, then that user would be counted as both a new customer and an existing customer in that day - because technically they are.
The report is actually totaling up the number of orders. But, it is presenting those totals in a way that shows new customers versus existing customers.
Below the sales graph is a detailed output showing order date, with the number of new customers and existing customers for each day. Due to the amount of data, it is recommended that you do not try to display more than 45 days so the graph will be readable.
Page Views
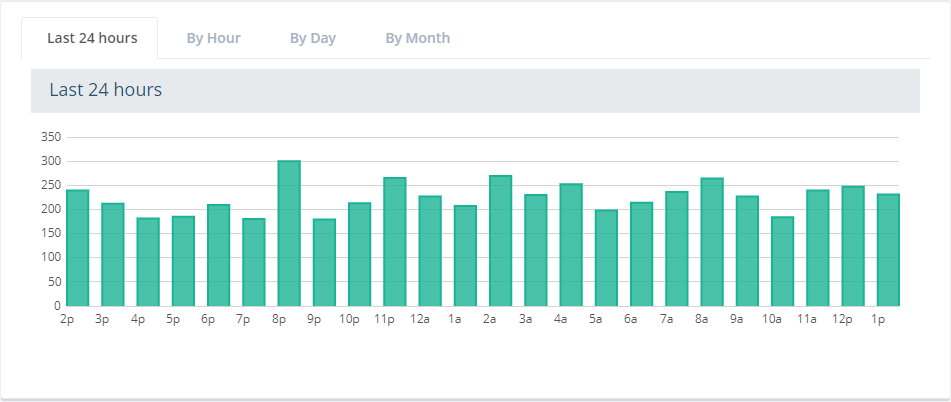
The Page Views over time report will show the number of views by month, day, hour, or the last 24 hours. You will need to be storing this history before data will appear. To enable the Page Tracking feature, you need to make sure that tracking feature is enabled from the Configure > Store > Page Tracking page.
Using the menu, go to the Reports > Customers > Page Views page.
Select a tab to view activity from the Last 24 hours, by Hour, by Day, or by Month.
Abandoned Baskets
The Abandoned Basket report displays the number of baskets created for a time period.
Using the menu, go to the Reports > Customers > Abandoned Baskets page.
Select a Report Period using the Month and Year selections. By default, the current month is shown.
Use the NEXT and PREVIOUS buttons to skip forward or back by one month at a time.
At the top of the page, a graph is shown for the month selected.
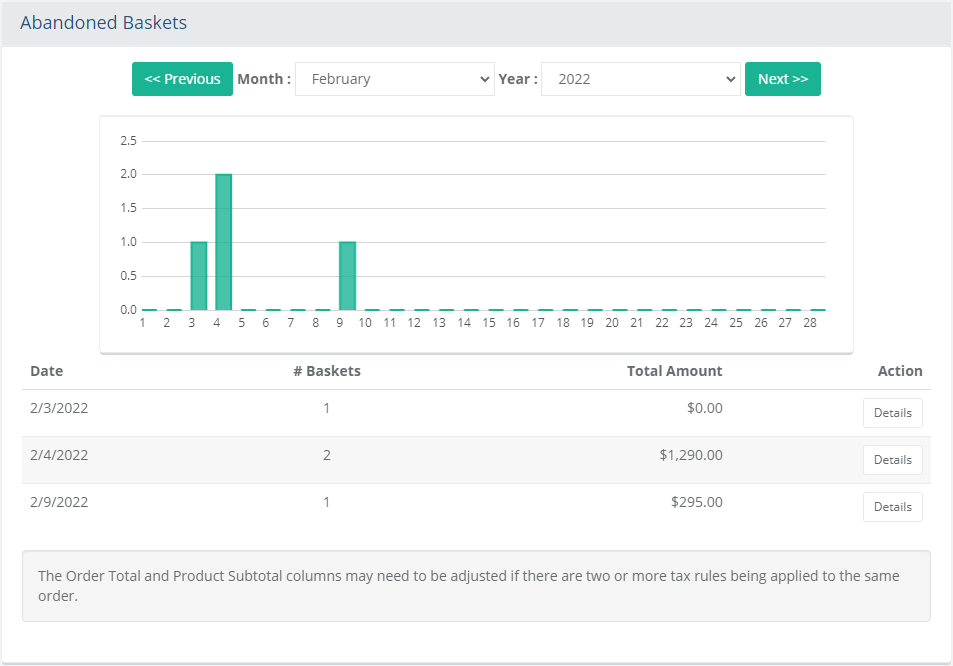
The corresponding detailed report is shown below the graph. A summary of the day's total number of abandoned baskets is shown.Click the Details button to view the Daily Abandoned Basket report. Change the date as needed.

From the Daily Abandoned Basket report, you can view the activities in detail.
Customer - If logged in while shopping, the name of the registered user will be shown. For anonymous users, an identification number will be displayed.
Items in Basket - Represents the number of products in the user's shopping cart.
Basket Total - Represents the total value of the shopping cart contents.
Last Activity - The date and time of user's last visit to the store.If desired, an Admin user can click on the Create Order button, from the Action column, to place a new order using the items in the abandoned cart.
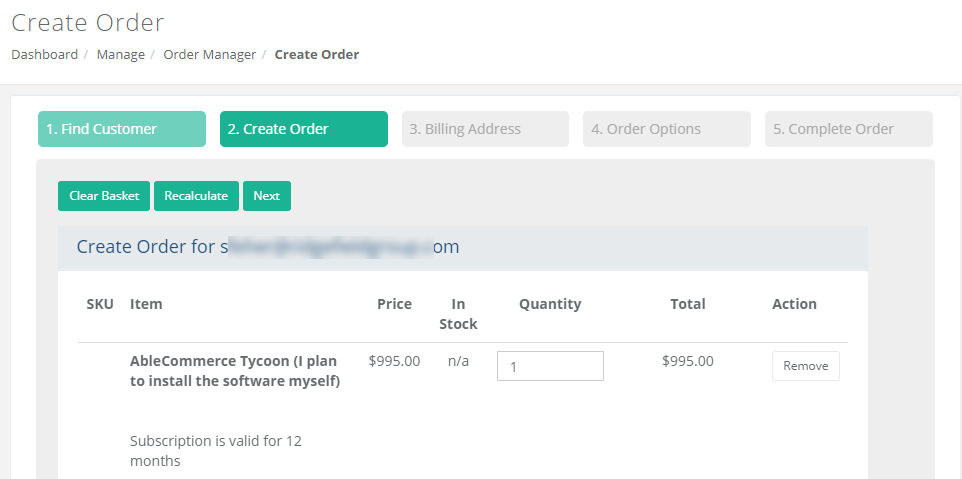
If a registered user is recognized, then the Send Alert button is available from the Action column of the daily report page.
If you click this button, the 'Abandoned Basket Alert' email template will launch.
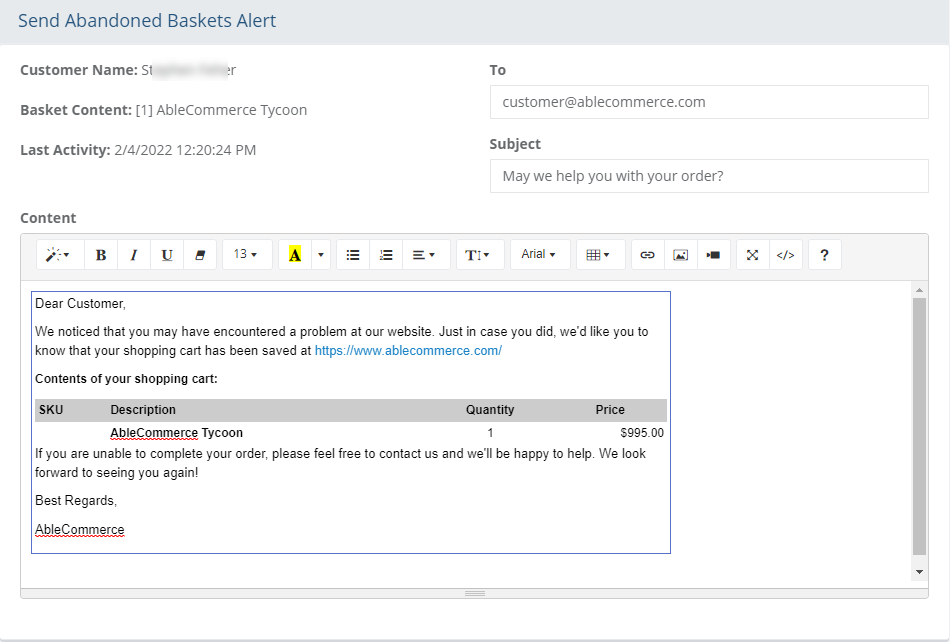
Make changes if needed, and then click the Send Alert button.
The email template that is used for this purpose can be changed by going to Configure > Email > Settings.
Browser Popularity
The Browser Popularity report tracks the type of web browsers commonly used.
Using the menu, go to the Reports > Customers > Browser Popularity page.
Select a time frame FROM and TO using the Calendar picker and click the Report button.
By default, the current month is shown. This report displays a pie chart, as shown in this example.
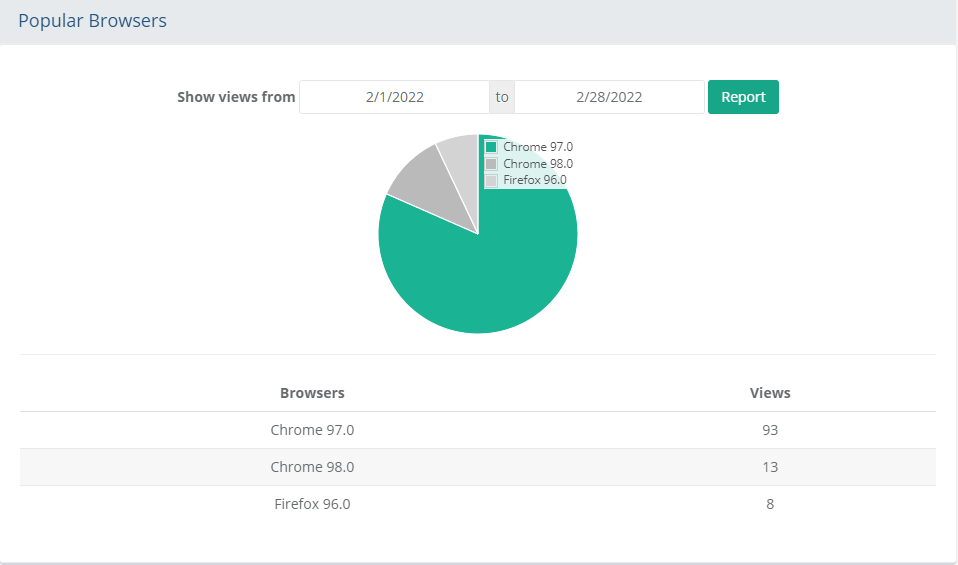
In the detailed report, the most
commonly used Browsers are listed by number of Views. Not
all browser types can be identified.
This feature requires that you have Page
Tracking enabled.
The length of time you select for Page Tracking configuration determines
the report period.
Search History
The customer search history can be displayed in a report if have the Page Tracking feature enabled.
Using the menu, go to the Reports > Customers > Search History page.
Select a time frame FROM and TO using the Calendar picker and click the Report button.
This report shows the search terms that are being entered into the main store search box.
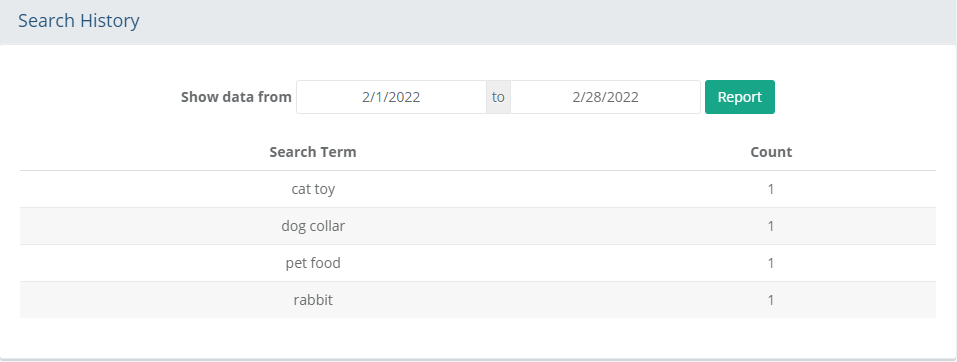
A number count is also shown in the last column.